BIREME/PAHO/WHO provides an Evidence Map Portal to promote the dissemination of and access to a collection of Evidence Maps, with an interface in English, Spanish, and Portuguese.
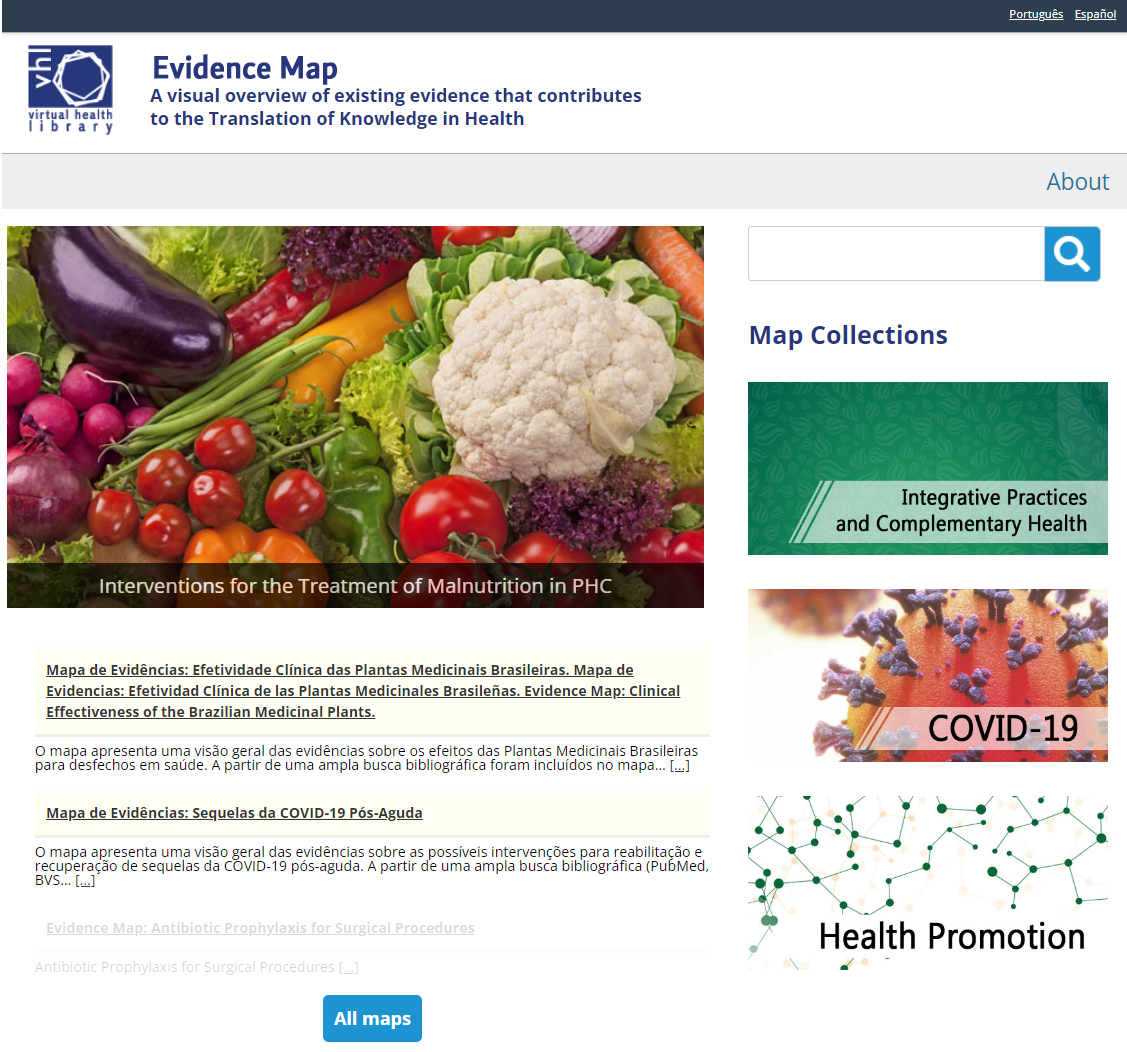
The portal aims to gather and integrate all Evidence Maps developed within the scope of the Virtual Health Library Network (VHL Network) and provides access to 36 evidence maps distributed in three main collections:
- Integrative and Complementary Health Practices – 23 maps
- Covid-19 – 5 maps
- Health Promotion – 6 maps
All maps produced based on the methodology adapted by BIREME are published on the Tableau Public BIREME platform, described in the Health Information Locator (HIL) of the Virtual Health Library (VHL).
Evidence Maps
Having as main reference the methodology “Evidence Gap Map” of the International Initiative for Impact Evaluation (3iE), BIREME adapted the “Evidence Map” methodology with the collaboration of the Brazilian Academic Consortium of Integrative Health (CABSIn) and the National Coordination of Integrative and Complementary Health Care Practices of the Ministry of Health (CNPICS/MS).
The motivation arose in 2019, from the need to answer the question: Is there evidence of clinical effectiveness of Integrative and Complementary Health Practices (ICHP)? The first maps commissioned by the Brazilian Ministry of Health were developed with the collaboration of a group of 40 researchers from the following practices: Yoga, Acupuncture, Auriculotherapy, Chinese Body Practices, Shantala, Meditation, and Oral Ozone Therapy. These maps served as proof of concept of the methodology and a great learning experience for the entire group involved.
As a result of the improvement of the methodology and the development of capacities to apply the methodology, working groups started the development of new maps of evidence related to PICS and other topics, such as maternal mortality, Chagas disease, elimination of the use of solid fuels for cooking, visceral leishmaniasis, malnutrition, leprosy, motorcycle accident, COVID-19 sequelae and others.
Verônica Abdala, manager of services and production of information sources at BIREME/PAHO/WHO, summarized “evidence maps contribute to reducing the distance between knowledge and practice in health, as they can be considered a tool for the translation of knowledge.”
 Evidence maps inserted in technical cooperation projects
The first evidence maps were produced in the context of a cooperation project with CNPICS/MS which, in addition to the maps themselves, enabled the adaptation of the methodology by BIREME/PAHO/WHO. From this initiative, the production of other maps was included in new cooperation projects with the Ministry of Health of Brazil, with the following areas:
– General Coordination of Food and Nutrition (CGAN/SAPS), Evidence Map on Malnutrition and Interventions in PHC
– Department of Science and Technology (DECIT/SCTIE), Evidence Map on Sequelae of Post-Acute COVID-19, and the Health Policy Assessment Evidence Map is under development.
– Project FIOCRUZ-VPGDI-014-FIO-20, with funding from the Ministry of Health, 6 Evidence Maps under development on the clinical effectiveness of Cupping Therapy, Homeopathy, Aromatherapy, Apitherapy, Moxibustion, and Brazilian Medicinal Plants.
What is the Evidence Map?
The Evidence Map is a research methodology that allows the systematization and graphic representation of the evidence analyzed in review studies in an area or subarea in relation to the effect of the analyzed interventions on health outcomes.
Evidence is mapped and applied across a matrix of interventions and outcomes, graphically highlighting gaps where there are few or no review studies and where there is a concentration of studies. Evidence mapping is not the same as a systematic review, but it has some features in common.
The maps are developed in four stages: (1) Bibliographic Search and Selection of Studies that will be included in the map according to the thematic scope of the map; (2) Characterization of Studies to extract data that will be associated and graphically represented on the map: intervention, outcome, intervention effect, population and others; (3) Assessment of the methodological quality of the studies to establish the level of confidence establish the level of confidence for the evidence reported in the intervention/outcome/effect associations; and (4) Processing and publication of the Map – the map itself is the result of processing the data characterized and represented in a spreadsheet that generates a graphic visualization of the mapped evidence relating interventions to outcomes.
To serve so many groups interested in the methodology of evidence maps, a self-learning course was developed and published on the UNA-SUS/FIOCRUZ platform. This course (Portuguese) is being updated and will soon be available in Portuguese, Spanish, English, and French on the Virtual Campus of Public Health (CVSP).